
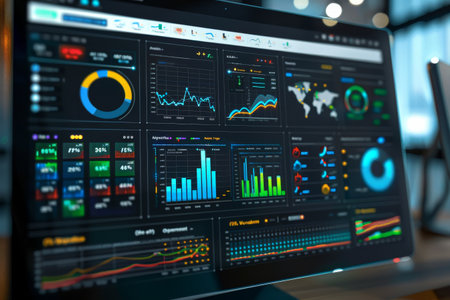
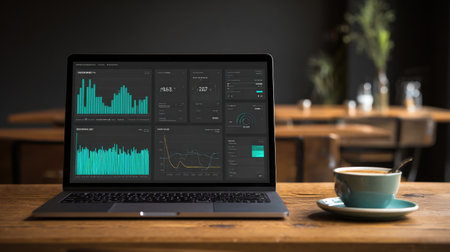
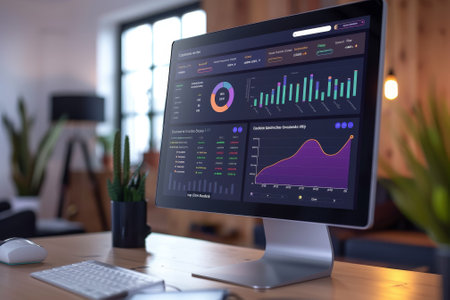
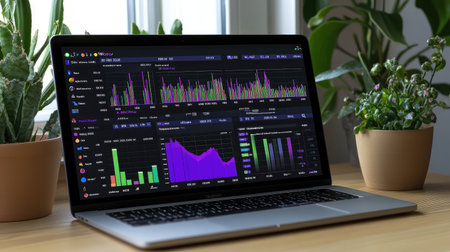
A sleek laptop shows a modern digital dashboard with colorful data visualizations and analytics, set in a contemporary workspace, perfect for business insights.
Коллекция по умолчанию
Коллекция по умолчанию
Создать новую
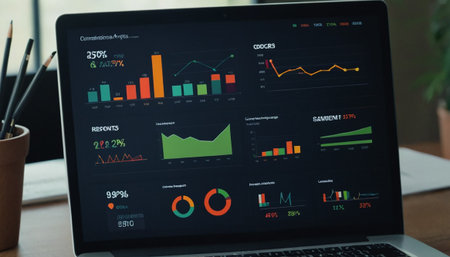
A sleek digital dashboard showcasing market analysis with engaging charts. Ideal for professionals seeking insights into financial performance and trends.
Коллекция по умолчанию
Коллекция по умолчанию
Создать новую
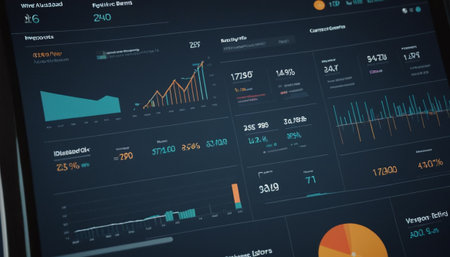
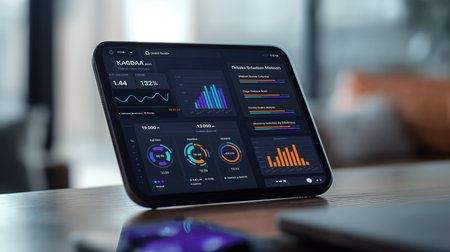
High-resolution image of a sleek data dashboard on a computer monitor showcasing financial analysis with various statistical graphs and trends.
Коллекция по умолчанию
Коллекция по умолчанию
Создать новую
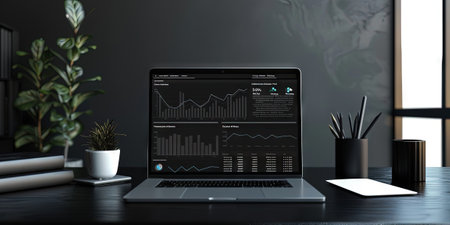
Graphs and charts representing financial metrics and trends are shown on a sleek laptop in a warmly lit room during the evening.
Коллекция по умолчанию
Коллекция по умолчанию
Создать новую
Apple Computers website. Apple Computers is an American multinational technology company headquartered in Cupertino, California.
Коллекция по умолчанию
Коллекция по умолчанию
Создать новую
A modern laptop displaying insightful data analytics sits on a wooden table alongside a steaming cup of coffee, creating a cozy and productive workspace atmosphere.
Коллекция по умолчанию
Коллекция по умолчанию
Создать новую
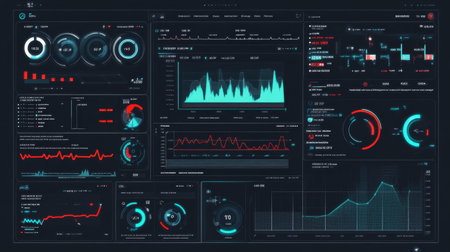
Close-up of a sophisticated data visualization dashboard featuring various graphs and analytics for monitoring performance and trends in real-time.
Коллекция по умолчанию
Коллекция по умолчанию
Создать новую
A stylish workspace featuring two monitors displaying vibrant data analytics dashboards. The setup combines technology with a cozy atmosphere, ideal for productivity.
Коллекция по умолчанию
Коллекция по умолчанию
Создать новую
Modern data dashboard showcasing global statistics, interactive charts, and visualizations for business intelligence in a contemporary workspace, enhancing decision-making.
Коллекция по умолчанию
Коллекция по умолчанию
Создать новую
Stock market chart on LED display, stock market data analysis concept.
Коллекция по умолчанию
Коллекция по умолчанию
Создать новую
Businessman analyzing investment charts on computer screen in office. Accounting and finance concept
Коллекция по умолчанию
Коллекция по умолчанию
Создать новую
A modern workspace featuring a computer monitor displaying data analytics graphs. A coffee cup and headphones are on the desk. A wall clock is visible.
Коллекция по умолчанию
Коллекция по умолчанию
Создать новую
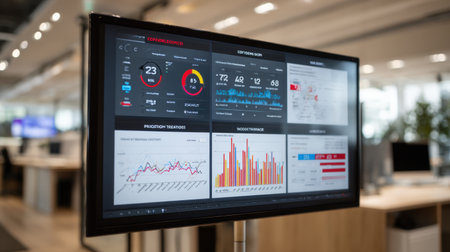
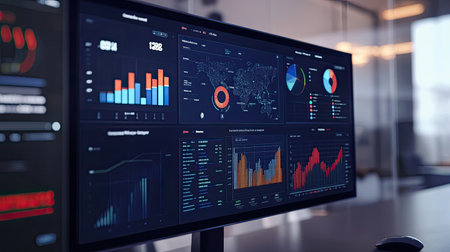
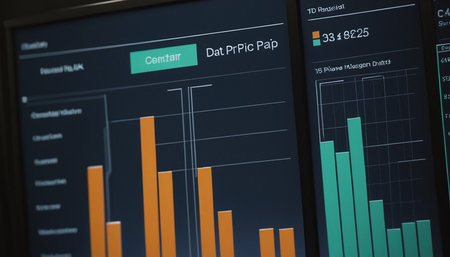
A detailed view of a professional business dashboard showcasing various analytical data on a digital screen in a contemporary office setting, perfect for presentations.
Коллекция по умолчанию
Коллекция по умолчанию
Создать новую

Laptop showcasing dynamic data visualizations with colorful graphs. The device is placed amidst flowers under illuminated skies at night. Clear view of the screen highlights analytical insights.
Коллекция по умолчанию
Коллекция по умолчанию
Создать новую
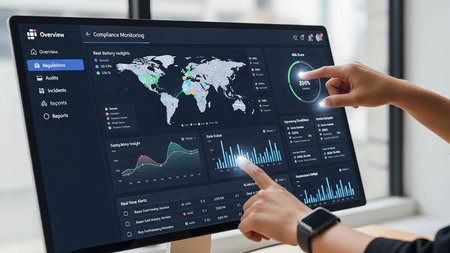
A person points at a computer screen displaying a compliance monitoring dashboard with a world map and various data charts.
Коллекция по умолчанию
Коллекция по умолчанию
Создать новую
African Advisor Using KPI Dashboard With Financial Analytics Graphs
Коллекция по умолчанию
Коллекция по умолчанию
Создать новую
Digital Dashboard Interface
Коллекция по умолчанию
Коллекция по умолчанию
Создать новую
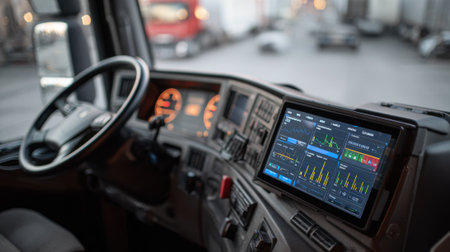
Medium shot capturing an electronic logging device integrated into a truck cabin showing driver hours data while steering wheel and seats are blurred in the background.
Коллекция по умолчанию
Коллекция по умолчанию
Создать новую
data procurement technology
Коллекция по умолчанию
Коллекция по умолчанию
Создать новую
Loading progress bar Load or download and upload circle and speed loader icon. Status or loader progress percentage bar for website or internet page in neon gradient.
Коллекция по умолчанию
Коллекция по умолчанию
Создать новую
Laptop with the chart on screen. Business and finance concept
Коллекция по умолчанию
Коллекция по умолчанию
Создать новую
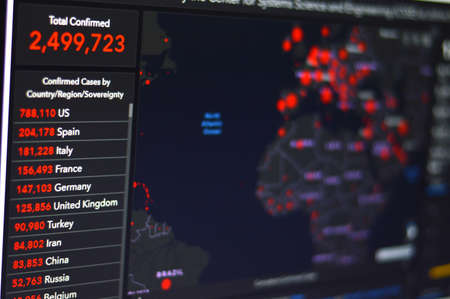
Green Number of Total Recovered from . Coronavirus COVID-19 global cases Map. Red Dot showing the number of infected. Johns Hopkins University map on monitor display.
Коллекция по умолчанию
Коллекция по умолчанию
Создать новую
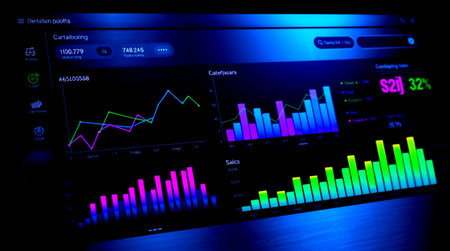
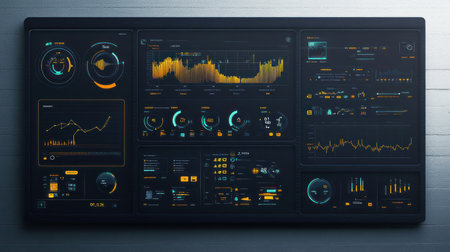
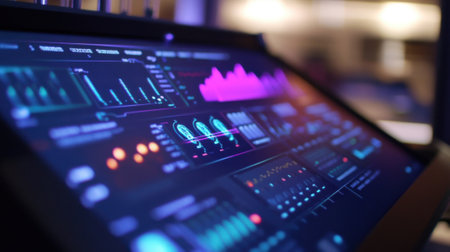
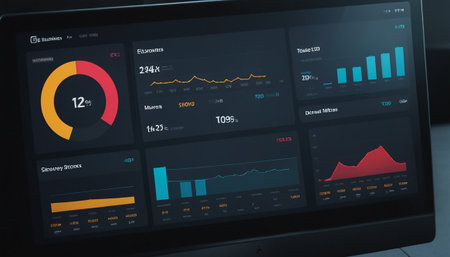
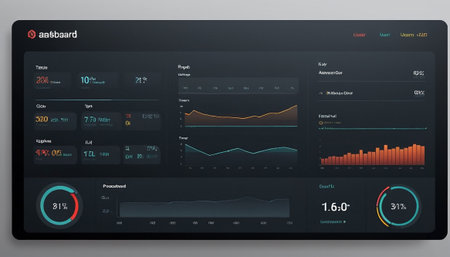
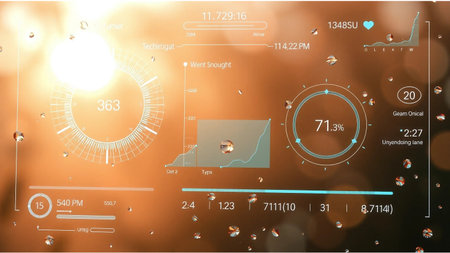
Futuristic dashboard with financial data on a dark background. The concept of business analysis and planning.
Коллекция по умолчанию
Коллекция по умолчанию
Создать новую
Celebration background with serpentine and confetti. Vector illustration.
Коллекция по умолчанию
Коллекция по умолчанию
Создать новую
Unleashing Business Insights: Exploring a Virtual Screen with an Interactive Business Intelligence Analyst Dashboard and Spectacular Big Data Graphs and Charts
Коллекция по умолчанию
Коллекция по умолчанию
Создать новую
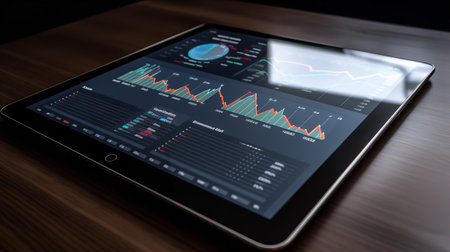
A close-up of graphs and charts displayed on a touch screen tablet, representing data analysis in business operations.
Коллекция по умолчанию
Коллекция по умолчанию
Создать новую

Close up shot with the digital speedometer of a car.
Коллекция по умолчанию
Коллекция по умолчанию
Создать новую

Laptop with stock market data on screen, stock market data concept
Коллекция по умолчанию
Коллекция по умолчанию
Создать новую
Analyzing data on interactive digital screen
Коллекция по умолчанию
Коллекция по умолчанию
Создать новую
A sleek data dashboard showcasing visual analytics and insights with graphs and metrics. Perfect for business performance analysis and reporting.
Коллекция по умолчанию
Коллекция по умолчанию
Создать новую
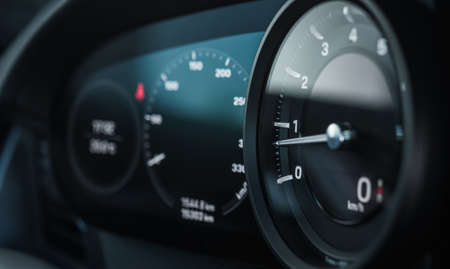
Rev Counter Tachometer Instrument in Modern Car Dashboard. Revolution-Counter Measuring Device. Automotive and Transportation Technology.
Коллекция по умолчанию
Коллекция по умолчанию
Создать новую
A computer screen displaying a plethora of data and information related to key performance indicators, A digital dashboard tracking key performance indicators
Коллекция по умолчанию
Коллекция по умолчанию
Создать новую
Closeup of a maglev pods control interface displaying an array of data points and visualizations where AGI algorithms analyze nearby pod speeds and predicted movements to ensure seamles
Коллекция по умолчанию
Коллекция по умолчанию
Создать новую
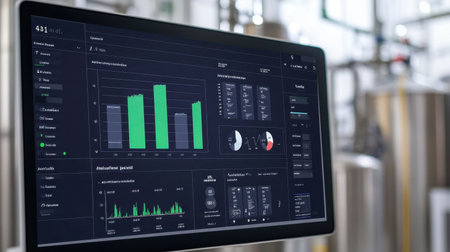
Factory dashboard with real-time alerts, maintenance schedule, and energy usage displayed
Коллекция по умолчанию
Коллекция по умолчанию
Создать новую
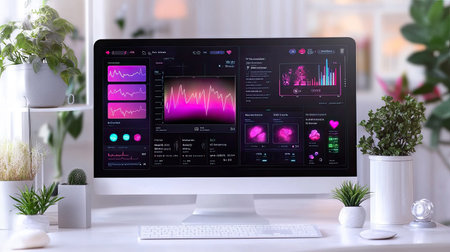
A sleek health dashboard displaying vibrant pink analytics and statistics on a modern monitor, surrounded by decorative plants. Perfect for tech and health visuals.
Коллекция по умолчанию
Коллекция по умолчанию
Создать новую
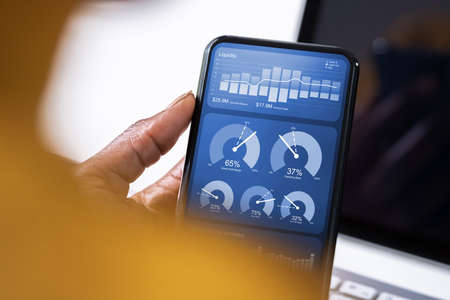
A sleek smartphone shows vibrant data charts and graphs against a dark background. The device captures attention with its user-friendly interface and illuminated ambiance.
Коллекция по умолчанию
Коллекция по умолчанию
Создать новую
Computer screen with stock market data on the screen. Stock market data concept.
Коллекция по умолчанию
Коллекция по умолчанию
Создать новую
In a dimly lit workspace, a laptop showcases a vibrant dashboard user interface, accompanied by two coffee mugs on a rustic wooden table.
Коллекция по умолчанию
Коллекция по умолчанию
Создать новую
Stock market data on monitor. Financial graph on monitor. Stock market data on monitor. Stock market data on monitor. Business graph on monitor. Stock market data on monitor.
Коллекция по умолчанию
Коллекция по умолчанию
Создать новую
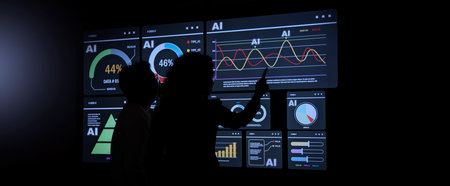
AI Using. Silhouetted analysts interact with a large AI data. AI Display charts graphs and analytics. Business team using futuristic AI interface visuals data. Technology with biz insights and ai data
Коллекция по умолчанию
Коллекция по умолчанию
Создать новую
Traffic monitoring system displays data in urban area during evening hours
Коллекция по умолчанию
Коллекция по умолчанию
Создать новую
displays the development of the covid-19 outbreak throughout the official website on an online computer, Tarakan - Indonesia 21 April 2020
Коллекция по умолчанию
Коллекция по умолчанию
Создать новую
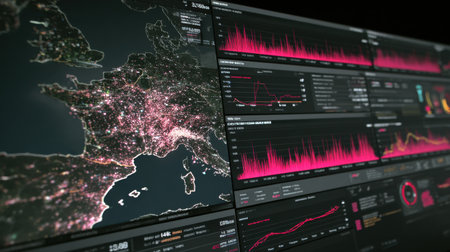
This captivating image showcases a high-tech data dashboard filled with network metrics and statistical graphs, highlighting urban activity across Europe at night.
Коллекция по умолчанию
Коллекция по умолчанию
Создать новую
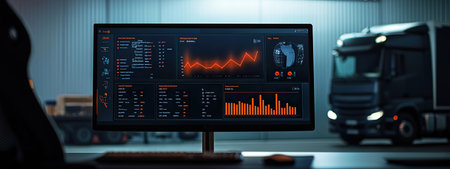
Software dashboard displays logistics data while truck is parked inside a warehouse
Коллекция по умолчанию
Коллекция по умолчанию
Создать новую
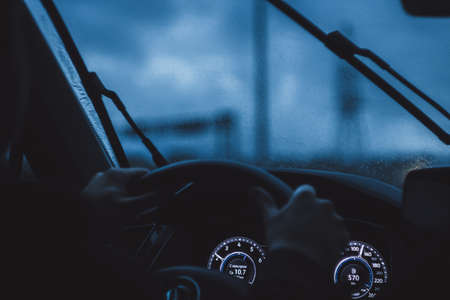
Drivers hands on wheel and city nightlife during rain
Коллекция по умолчанию
Коллекция по умолчанию
Создать новую
Closeup of monitor with charts and graphs on screen. Business concept
Коллекция по умолчанию
Коллекция по умолчанию
Создать новую
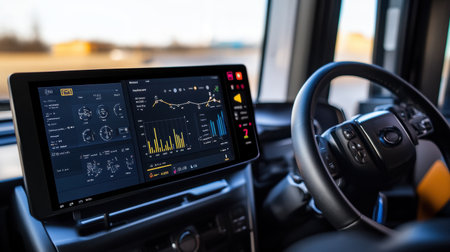
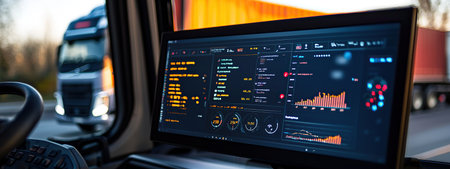
Close-up view of a sleek vehicle dashboard featuring advanced technology, displaying performance metrics and navigation tools for a modern truck driving experience.
Коллекция по умолчанию
Коллекция по умолчанию
Создать новую
Open laptop showing financial charts and data analysis on its screen, placed in a dimly lit room, suggesting late night work or focused analysis
Коллекция по умолчанию
Коллекция по умолчанию
Создать новую
An environmental monitoring station where AI detects changes in ecosystems and predicts weather patterns accurately
Коллекция по умолчанию
Коллекция по умолчанию
Создать новую
Close-up of graphs and charts on computer screen. Business concept
Коллекция по умолчанию
Коллекция по умолчанию
Создать новую
Digital screen showcases a crypto gambling dashboard with vibrant stats and analytics, designed for real-time monitoring and decision making.
Коллекция по умолчанию
Коллекция по умолчанию
Создать новую
A sleek laptop showcasing a detailed business analytics dashboard filled with graphs and charts, set in a stylish office environment emphasizing modern workspace trends.
Коллекция по умолчанию
Коллекция по умолчанию
Создать новую
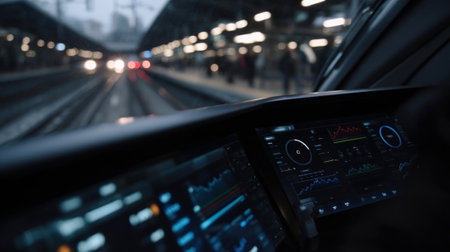
A detailed view of a futuristic vehicle's dashboard, showcasing intricate data visualizations, gauges, and digital displays in a dimly lit interior, creating a high-tech ambiance.
Коллекция по умолчанию
Коллекция по умолчанию
Создать новую
Close-up view of a laptop displaying data analysis with charts and graphs, perfect for showcasing technology, finance, or business analytics themes.
Коллекция по умолчанию
Коллекция по умолчанию
Создать новую
A sleek and modern data dashboard showcasing various analytical charts and statistics set against a scenic urban view, ideal for business insights.
Коллекция по умолчанию
Коллекция по умолчанию
Создать новую
Realistic UI UX GUI screen template for web site or mobile app
Коллекция по умолчанию
Коллекция по умолчанию
Создать новую
Laptop displaying business analytics dashboard with key performance metrics and charts
Коллекция по умолчанию
Коллекция по умолчанию
Создать новую
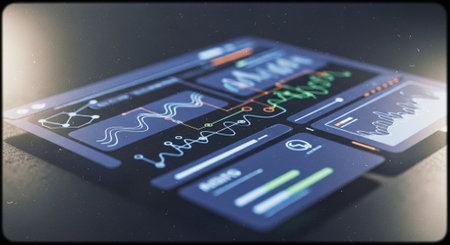
A close-up view of a digital tablet displaying an intricate data visualization. The bright lines and points create a striking contrast against the dark background.
Коллекция по умолчанию
Коллекция по умолчанию
Создать новую

Low angle camera shot of african american employee alone at work, enjoying music while checking financial data charts on computer. Bookkeeper with headphones on working in office during nightshift
Коллекция по умолчанию
Коллекция по умолчанию
Создать новую
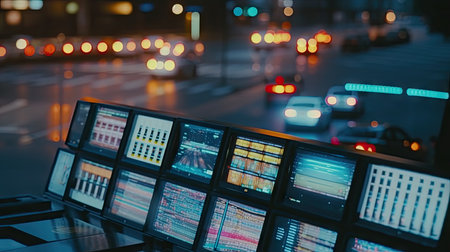
illustration of AI day and robotic illustration, 3d realistic
Коллекция по умолчанию
Коллекция по умолчанию
Создать новую
Data HUD diagram design, graph and chart modern graphic interface. Data analysis and strategic decision making in business management. Generative AI illustration
Коллекция по умолчанию
Коллекция по умолчанию
Создать новую
mitor data on monitor
Коллекция по умолчанию
Коллекция по умолчанию
Создать новую

Futuristic car showing its navigation system and digital dashboard while driving through a city at night
Коллекция по умолчанию
Коллекция по умолчанию
Создать новую
A tablet displaying a pie chart with various investment categories, emphasizing diversification in financial planning
Коллекция по умолчанию
Коллекция по умолчанию
Создать новую
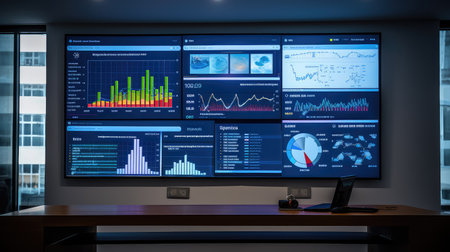
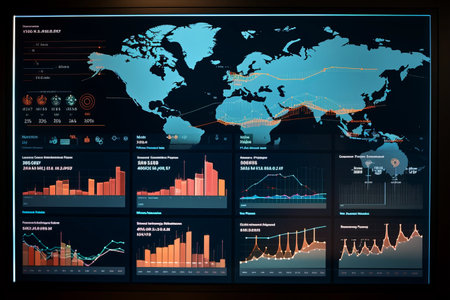
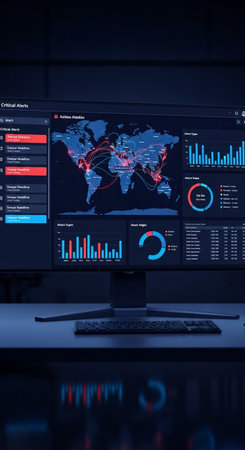
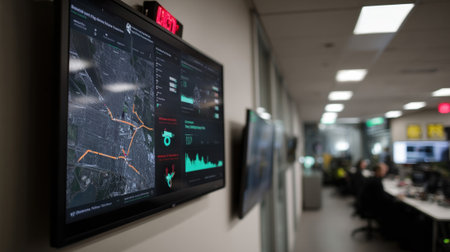
A modern control room featuring multiple large screens showcasing intricate data visualizations and a world map, emphasizing technology and analytics.
Коллекция по умолчанию
Коллекция по умолчанию
Создать новую
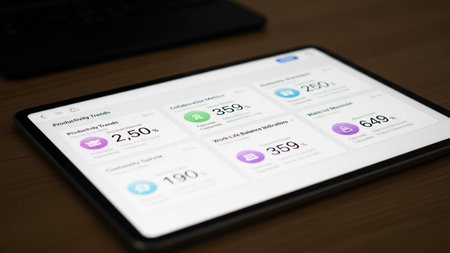
This image shows a tablet device displaying a digital dashboard with various health metrics. The dashboard includes sections for productivity trends, caloric intake, sleep monitoring, work-life balance scores, and step counts. Each section has a visual representation, such as graphs and icons, to provide a clear overview of the user's health and productivity data.
Коллекция по умолчанию
Коллекция по умолчанию
Создать новую
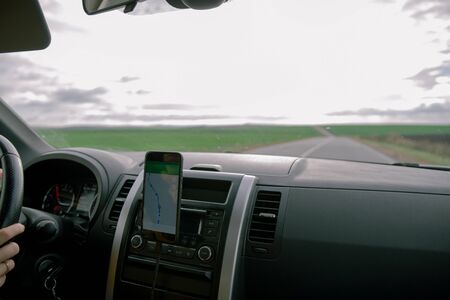
GPS navigator on the screen of a mobile phone at sunset
Коллекция по умолчанию
Коллекция по умолчанию
Создать новую
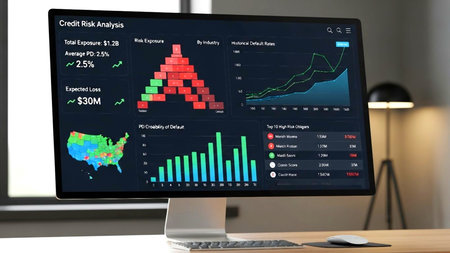
Dashboard displaying credit risk analysis with various charts and data visualizations.
Коллекция по умолчанию
Коллекция по умолчанию
Создать новую

Car dashboard with lit speedometer and tachometer in factory setting
Коллекция по умолчанию
Коллекция по умолчанию
Создать новую
Stock market data on monitor. Business financial graph on monitor screen. Stock market data on monitor. Business financial graph on monitor.
Коллекция по умолчанию
Коллекция по умолчанию
Создать новую
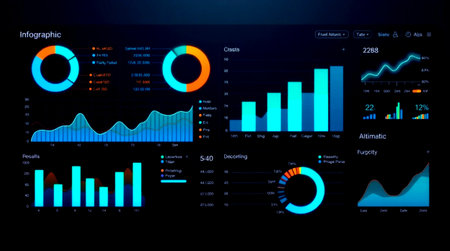
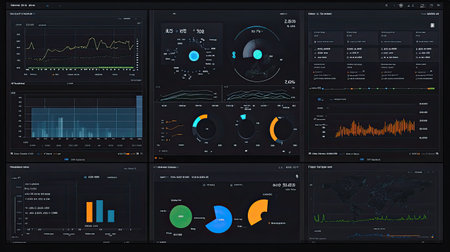
Sleek and modern data visualization interface showcasing various metrics, graphs, and analytical insights for effective business intelligence and performance monitoring.
Коллекция по умолчанию
Коллекция по умолчанию
Создать новую
Closeup of modern computer monitor with world map. Global business concept.
Коллекция по умолчанию
Коллекция по умолчанию
Создать новую
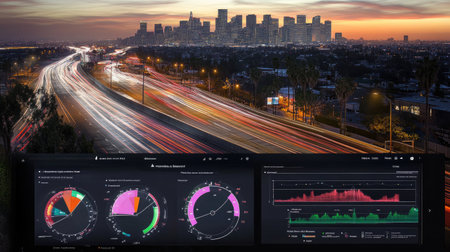
A stunning cityscape showcases a vibrant skyline at dusk, highlighted by flowing traffic and dynamic data visualizations. Perfect for technology and urban themes.
Коллекция по умолчанию
Коллекция по умолчанию
Создать новую
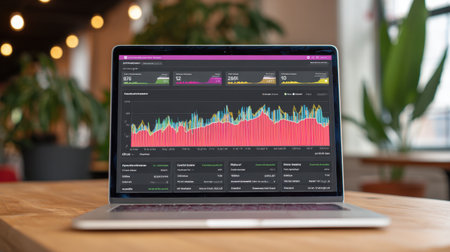
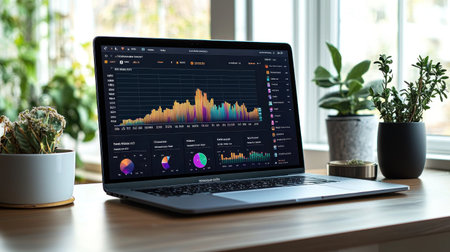
A modern laptop displays a vibrant analytics dashboard with colorful graphs and performance metrics, set in a stylish workspace adorned with plants.
Коллекция по умолчанию
Коллекция по умолчанию
Создать новую
Real-time data analysis at a logistics hub during sunset with a truck in the background
Коллекция по умолчанию
Коллекция по умолчанию
Создать новую
KPI Dashboard Data Analytics On Business Laptop
Коллекция по умолчанию
Коллекция по умолчанию
Создать новую

Financial data on a monitor,Stock market data on LED display concept
Коллекция по умолчанию
Коллекция по умолчанию
Создать новую
Closeup medium shot of a digital screen showing predictive maintenance graphs and alert notifications with an outoffocus control room behind.
Коллекция по умолчанию
Коллекция по умолчанию
Создать новую
An AI-powered social media data analytics platform, showing trends, sentiments, and user engagement metrics. This image demonstrates the role of AI in social media analytics.
Коллекция по умолчанию
Коллекция по умолчанию
Создать новую
car rent concept driving by speedway misty weather
Коллекция по умолчанию
Коллекция по умолчанию
Создать новую
A sleek tablet showing a competitor analysis report, placed on a wooden business desk.
Коллекция по умолчанию
Коллекция по умолчанию
Создать новую
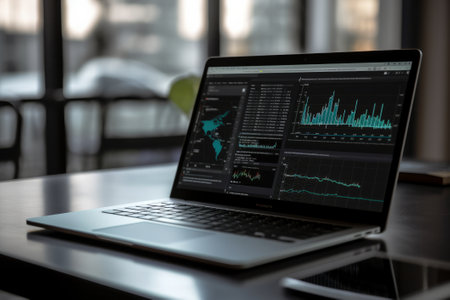
A laptop on a wooden desk displays a vibrant financial data dashboard, set in a tranquil, modern office with lush green plants and soft, natural window light.
Коллекция по умолчанию
Коллекция по умолчанию
Создать новую
Dashboard display of a waste management control center showing a map of the city with highlighted routes for garbage trucks based on bin capacity data
Коллекция по умолчанию
Коллекция по умолчанию
Создать новую
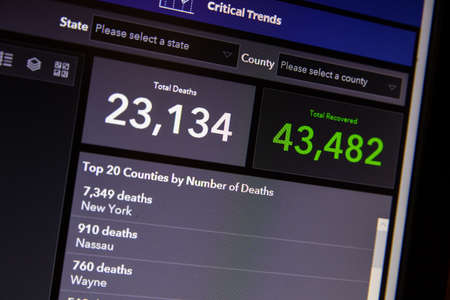
NAMPA, IDAHO - APRIL 14, 2020: John hopkins tracks deaths vs recovery
Коллекция по умолчанию
Коллекция по умолчанию
Создать новую
A computer monitor displays a graph with a purple line and a green line
Коллекция по умолчанию
Коллекция по умолчанию
Создать новую
Laptop screen with financial charts on table. 3d rendering.
Коллекция по умолчанию
Коллекция по умолчанию
Создать новую
A digital dashboard displaying real-time data and analytics, representing customer service management and business automation
Коллекция по умолчанию
Коллекция по умолчанию
Создать новую
Smart laptop screen display financial statistic graph or stock market chart. Dashboard show real time marketing business strategy graph represented increasing sales or trading money currency. AIG42.
Коллекция по умолчанию
Коллекция по умолчанию
Создать новую
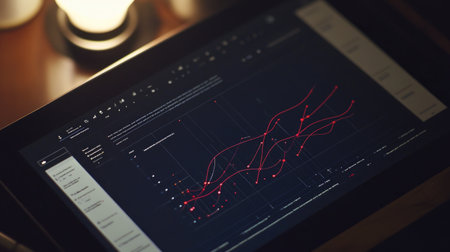
A digital tablet showcases complex data visualizations with red graphics against a dark background. The scene suggests an indoor setting, possibly an office, with a wooden surface and blurred background elements. The image may serve for technology-related content, business analytics, or other commercial purposes.
Коллекция по умолчанию
Коллекция по умолчанию
Создать новую
A modern digital health record interface displaying patient data and analytics
Коллекция по умолчанию
Коллекция по умолчанию
Создать новую
Close-up of a computer screen displaying colorful data visualizations and graphs in a bright office environment, highlighting financial metrics and analytical insights for business growth.
Коллекция по умолчанию
Коллекция по умолчанию
Создать новую
Futuristic virtual graphic touch user interface HUD. Elements for your design
Коллекция по умолчанию
Коллекция по умолчанию
Создать новую
Futuristic touch user interface. 3d rendering toned image
Коллекция по умолчанию
Коллекция по умолчанию
Создать новую
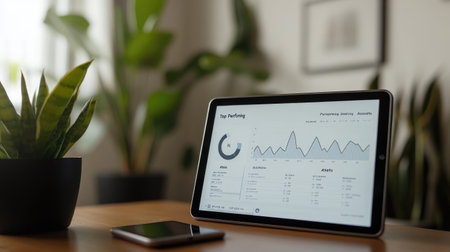
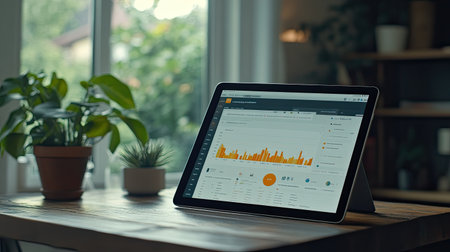
A modern workspace featuring a tablet displaying data analysis surrounded by indoor plants, creating a focus on productivity and innovation in a clean, professional environment.
Коллекция по умолчанию
Коллекция по умолчанию
Создать новую
Financial data analyzing on monitor. Abstract financial data analysis on monitor.
Коллекция по умолчанию
Коллекция по умолчанию
Создать новую
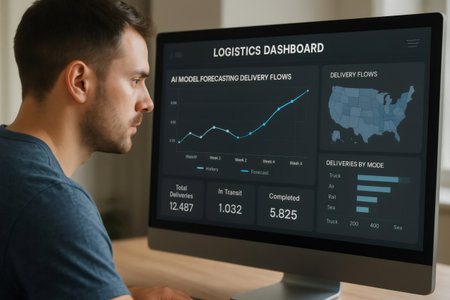
Logistics manager analyzing delivery flows on a computer screen, using artificial intelligence and data visualization tools to optimize supply chain operations in the United States
Коллекция по умолчанию
Коллекция по умолчанию
Создать новую
A digital financial dashboard on a laptop showing graphs and statistics, offering space to add copy about business finance strategies, cash flow management, or budgeting tips
Коллекция по умолчанию
Коллекция по умолчанию
Создать новую
Laptop screen displaying stock market data on the screen. Stock market data concept
Коллекция по умолчанию
Коллекция по умолчанию
Создать новую
Strategic Business Insights Visualize Your Success with KPI Metrics Dashboard
Коллекция по умолчанию
Коллекция по умолчанию
Создать новую
Image of financial data processing over city. Global networks, business, finances, computing and data processing concept digitally generated image.
Коллекция по умолчанию
Коллекция по умолчанию
Создать новую
Legion-Media
Создайте свои проекты на основе качественных стоковых фотографий и видео.


Copyright © Legion-Media.